Java Memory Model
The Java memory model specifies how the Java virtual machine works with the computer's memory (RAM). The Java virtual machine is a model of a whole computer so this model naturally includes a memory model - AKA the Java memory model.
It is very important to understand the Java memory model if you want to design correctly behaving concurrent programs. The Java memory model specifies how and when different threads can see values written to shared variables by other threads, and how to synchronize access to shared variables when necessary.
The original Java memory model was insufficient, so the Java memory model was revised in Java 1.5. This version of the Java memory model is still in use in Java 8.
The Architecture of the Java Virtual Machine
In the Java virtual machine specification, the behavior of a virtual machine instance is described in terms of subsystems, memory areas, data types, and instructions. These components describe an abstract inner architecture for the abstract Java virtual machine. The purpose of these components is not so much to dictate an inner architecture for implementations. It is more to provide a way to strictly define the external behavior of implementations. The specification defines the required behavior of any Java virtual machine implementation in terms of these abstract components and their interactions.
Figure shows a block diagram of the Java virtual machine that includes the major subsystems and memory areas described in the specification. As mentioned in previous chapters, each Java virtual machine has a class loader subsystem: a mechanism for loading types (classes and interfaces) given fully qualified names. Each Java virtual machine also has an execution engine: a mechanism responsible for executing the instructions contained in the methods of loaded classes.
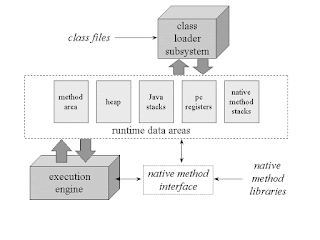 When a Java virtual machine runs a program, it needs memory to store many things, including bytecodes and other information it extracts from loaded class files, objects the program instantiates, parameters to methods, return values, local variables, and intermediate results of computations. The Java virtual machine organizes the memory it needs to execute a program into several runtime data areas.
Although the same runtime data areas exist in some form in every Java virtual machine implementation, their specification is quite abstract. Many decisions about the structural details of the runtime data areas are left to the designers of individual implementations.
Different implementations of the virtual machine can have very different memory constraints. Some implementations may have a lot of memory in which to work, others may have very little. Some implementations may be able to take advantage of virtual memory, others may not. The abstract nature of the specification of the runtime data areas helps make it easier to implement the Java virtual machine on a wide variety of computers and devices.
Some runtime data areas are shared among all of an application's threads and others are unique to individual threads. Each instance of the Java virtual machine has one method area and one heap. These areas are shared by all threads running inside the virtual machine. When the virtual machine loads a class file, it parses information about a type from the binary data contained in the class file. It places this type information into the method area. As the program runs, the virtual machine places all objects the program instantiates onto the heap. See Figure 5-2 for a graphical depiction of these memory areas.


The Java memory model specifies how the Java virtual machine works with the computer's memory (RAM). The Java virtual machine is a model of a whole computer so this model naturally includes a memory model - AKA the Java memory model.
It is very important to understand the Java memory model if you want to design correctly behaving concurrent programs. The Java memory model specifies how and when different threads can see values written to shared variables by other threads, and how to synchronize access to shared variables when necessary.
The original Java memory model was insufficient, so the Java memory model was revised in Java 1.5. This version of the Java memory model is still in use in Java 8.
The Architecture of the Java Virtual Machine
In the Java virtual machine specification, the behavior of a virtual machine instance is described in terms of subsystems, memory areas, data types, and instructions. These components describe an abstract inner architecture for the abstract Java virtual machine. The purpose of these components is not so much to dictate an inner architecture for implementations. It is more to provide a way to strictly define the external behavior of implementations. The specification defines the required behavior of any Java virtual machine implementation in terms of these abstract components and their interactions.
Figure shows a block diagram of the Java virtual machine that includes the major subsystems and memory areas described in the specification. As mentioned in previous chapters, each Java virtual machine has a class loader subsystem: a mechanism for loading types (classes and interfaces) given fully qualified names. Each Java virtual machine also has an execution engine: a mechanism responsible for executing the instructions contained in the methods of loaded classes.
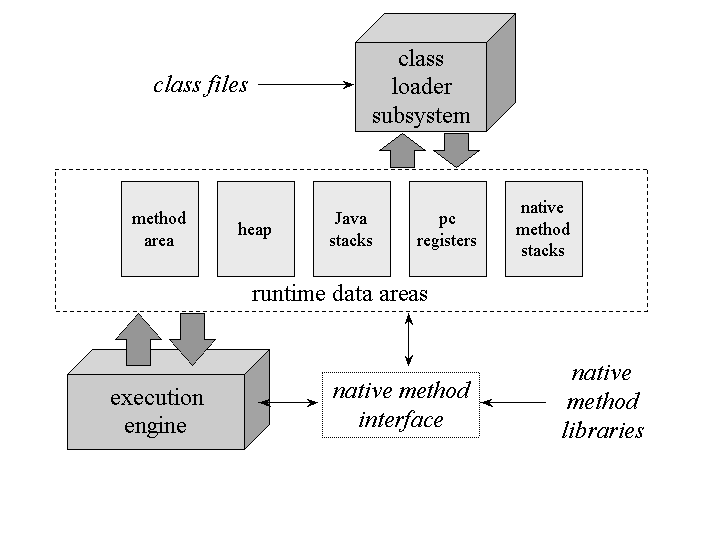
Although the same runtime data areas exist in some form in every Java virtual machine implementation, their specification is quite abstract. Many decisions about the structural details of the runtime data areas are left to the designers of individual implementations.
Different implementations of the virtual machine can have very different memory constraints. Some implementations may have a lot of memory in which to work, others may have very little. Some implementations may be able to take advantage of virtual memory, others may not. The abstract nature of the specification of the runtime data areas helps make it easier to implement the Java virtual machine on a wide variety of computers and devices.
Some runtime data areas are shared among all of an application's threads and others are unique to individual threads. Each instance of the Java virtual machine has one method area and one heap. These areas are shared by all threads running inside the virtual machine. When the virtual machine loads a class file, it parses information about a type from the binary data contained in the class file. It places this type information into the method area. As the program runs, the virtual machine places all objects the program instantiates onto the heap. See Figure 5-2 for a graphical depiction of these memory areas.

As each new thread comes into existence, it gets its own pc register (program counter) and Java stack. If the thread is executing a Java method (not a native method), the value of the pc register indicates the next instruction to execute. A thread's Java stack stores the state of Java (not native) method invocations for the thread. The state of a Java method invocation includes its local variables, the parameters with which it was invoked, its return value (if any), and intermediate calculations. The state of native method invocations is stored in an implementation-dependent way in native method stacks, as well as possibly in registers or other implementation-dependent memory areas.
The Java stack is composed of stack frames (or frames). A stack frame contains the state of one Java method invocation. When a thread invokes a method, the Java virtual machine pushes a new frame onto that thread's Java stack. When the method completes, the virtual machine pops and discards the frame for that method.
The Java virtual machine has no registers to hold intermediate data values. The instruction set uses the Java stack for storage of intermediate data values. This approach was taken by Java's designers to keep the Java virtual machine's instruction set compact and to facilitate implementation on architectures with few or irregular general purpose registers. In addition, the stack-based architecture of the Java virtual machine's instruction set facilitates the code optimization work done by just-in-time and dynamic compilers that operate at run-time in some virtual machine implementations.
See Figure for a graphical depiction of the memory areas the Java virtual machine creates for each thread. These areas are private to the owning thread. No thread can access the pc register or Java stack of another thread.


